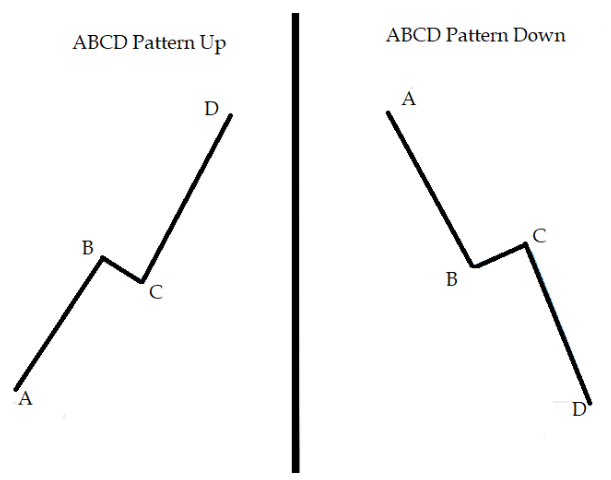
In technical analysis, we have different chart patterns to understand crowd psychology. One of such chart pattern is known as ABCD.
ABCD pattern forms when prices move higher or lower, followed by a flag pattern and then continue in the direction of the prevailing trend.
The ABCD pattern is based on the principle that stock prices move in waves. You will find this pattern both in uptrend and downtrend markets.
We have bullish and bearish ABCD patterns.

Bullish ABCD Pattern
A bullish ABCD pattern starts with an initial spike, which is a significant high.
In our above diagram (ABCD Pattern Up), point A to B and point C to D are known as legs, while point B to C is called correction or retracement or pullback.
Point A to B indicates the market is in control of the bull, who is aggressively buying and pushing the price higher.
However, once the stock’s price reached point B, some traders decided to take profit, therefore we see a healthy pull back from point B to C.
Price movement from point B to C is known as pullback.
If price does not come down from a level at point C, it means the pullback stops there as it has found a support at that point.
Now many traders will prefer to trade the stock with a protective stop below the pullback level to take profit at point D or at a higher price.
Bearish ABCD Pattern
Bearish ABCD pattern is the opposite of the bullish ABCD pattern.
In the above diagram (ABCD pattern down), Point A to B indicates the market is in control of the bears, who are aggressively selling and pushing the price lower.
Once the stock’s price reached point B, some market participants decided to take profit, therefore we see a healthy correction from point B to C.
After the correction ends at point C, traders go short from point C to D or till they see any kind of resistance at the lower level.
ABCD pattern is a continuation chart pattern like the most popular patterns Flag, Pennant and wedges.
Like other indicators in technical analysis, the ABCD pattern works best when used together with other chart patterns and technical tools.
Disclaimer: In addition to the disclaimer below, please note, this article is not intended to provide investing or trading advice. Trading in the stock market and in other securities entails varying degrees of risk, and can result in loss of capital. Most investors and traders lose money. Readers seeking to engage in trading and/or investing should seek out extensive education on the topic and help of professionals.