Head and shoulders pattern (sometimes marked by labels H&S or S-H-S) form at the top and bottom of a trend as a reversal formation. It can also be formed as a continuation or consolidation pattern during an ongoing trend.
In this article, we will be discussing the type of head and shoulders pattern, its formation and importance in technical analysis.
In technical analysis, chartists look for price pattern formation and try to analyse how price can move in future so that they can take a position.
Recognising correct chart patterns and understanding their importance within the market context is the key for success.
One of such mostly used price patterns by market participants is the Head and Shoulders pattern.
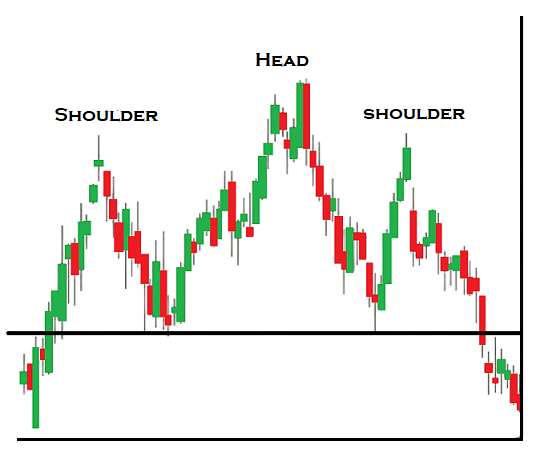
A head and shoulders pattern as shown in the diagram below is a chart pattern formation that appears as a baseline with 3 peaks, where in the outside two peaks close in height are referred to as left and right shoulders and the middle highest peak is referred to as head.
Head and shoulders patterns can form in an uptrend and downtrend to indicate trend reversal in the opposite direction. It’s considered as the most reliable trend reversal pattern to predict bullish-to-bearish trend reversal and bearish-to-bullish trend reversal.
Head and shoulders pattern formation at tops
The pattern is composed of a baseline, a “left shoulder”, a “head” and then a “right shoulder”. Out of which the head has a highest peak. Above diagram shows how the H & S pattern is formed at the top as a reversal signal.
In an uptrend, the head and shoulders pattern formed when the stock’s price rose to a peak and tried to reverse back to the original base. It’s a bullish-to-bearish trend reversal signal.
As discussed above, the head and shoulders pattern has following three components to complete the pattern in an uptrend;
- As a continuation of an uptrend, the price rises to a peak and reverses to form a tough.
- From the tough, prices rises again to form a second high substantially above the 1st peak and declines back again.
- After declining for the 2nd time, prices rise back for a third time up to the level of 1st peak or close to that, before declining further down.
The 2nd peak is called head and the other two peaks (1st and 3rd) are called left and right shoulders respectively.
This means, a head and shoulders chart pattern simply portrays three successive rallies and reactions, with the second one (the head) reaching a higher point than either of the two rallies (the left and right shoulders).
As shown in the above picture, the line that connects the 1st and 2nd tough is called the neckline or baseline.
When the third rally fails and price falls below the peak of the second, it signals a major trend reversal to the downside.
Head and shoulders at bottoms
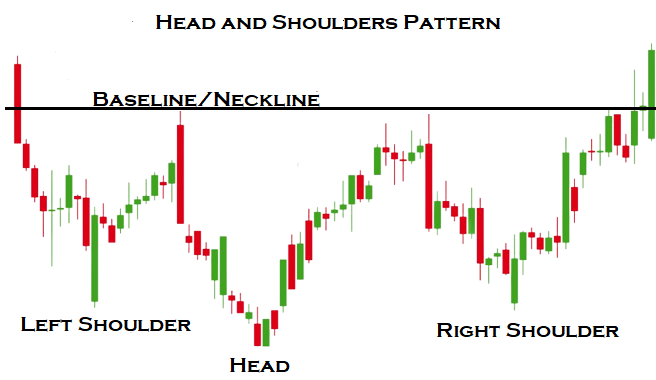
A head and shoulders chart patterns can also be formed at the market bottoms. Formation of this particular pattern at the bottom is known as reverse or inverse head and shoulders pattern.
In a downtrend, the head and shoulders pattern gets formed when prices fall to the last low and tries to reverse back to the original base. It’s a bearish-to-bullish trend reversal signal.
Here is how it looks line when created in a downtrend;
The head and shoulders is to be considered as a battle between bulls and bears.
In a downtrend, the pattern shows that bulls are getting stronger than the bears which is driving the prices up.
Importance of neckline in Head and Shoulders pattern
The neckline is the level of support or resistance that market participants use to determine the entry, stop loss and profit target of a trade.
Remember, no head and shoulders should be regarded as complete until the price breaks down below the neckline drawn tangent with the lows of the left and right shoulders.
After completion of the pattern, price may move back to the neckline for a test.
Sometimes the head and shoulders pattern will fail to penetrate the neckline.
The neckline is nothing more than a special trend line.
The most common entry point traders consider is a breakout of the neckline/baseline. Accordingly, the stop loss and profit target is defined based on the pattern.
Importance of volume in H&S
Technical analysts closely watch the price movement with volume to assess the probability of reversal.
In general, in an uptrend, if the right shoulder is accompanied by lower volume than the head and left shoulder, then it’s considered as a confirmation of reversal.
Likewise, in a downtrend, if the right shoulder is accompanied by higher volume in comparison to the head and left shoulder, then it’s considered as a confirmation of reversal.
Volume confirmation can work as a guide to know the strength and weakness in the pattern formation.
Downward and Upward sloping head and shoulders pattern
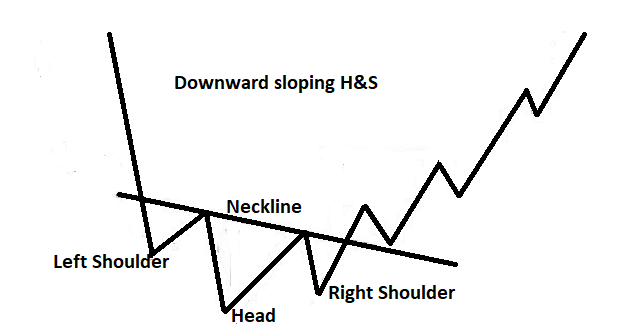
We can have many varieties of head and shoulders pattern formation. We can have horizontal, downward-sloping or upward-sloping.
So far, we have discussed horizontal Head and shoulders pattern formation. Downward and upward sloping H&S are formed more often than the horizontal.
Here is how a downward and upward sloping head and shoulders pattern is formed.
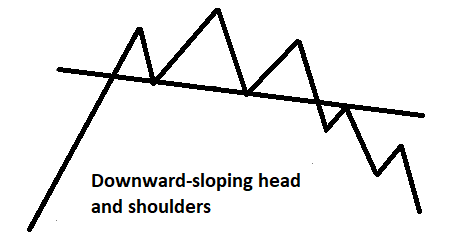
Downward-sloping head and shoulders pattern formation at the top of a trend is considered as more bearish than horizontal and upward-sloping H&S pattern.
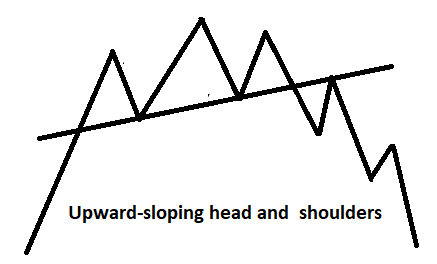
Here is how downward and upward sloping head and shoulders price patterns can be formed in a declining market.
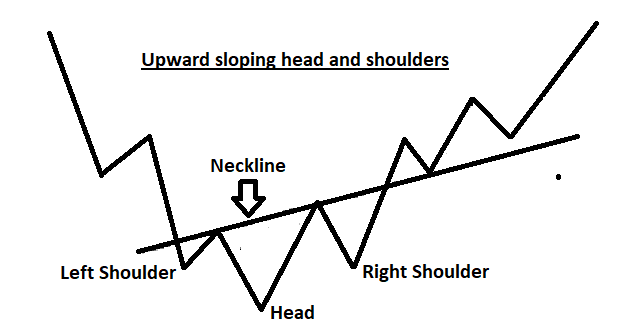
Upward-sloping head and shoulders pattern formation at the bottom of a downtrend is considered as more bullish than horizontal and downward-sloping H&S pattern.
Head and shoulders pattern can also be seen as a continuation pattern during an ongoing trend. Traders have to be careful while analysing the pattern as prices are determined by crowd psychology.
Here is how a head and shoulders pattern can be formed in a rising market as a trend continuation.
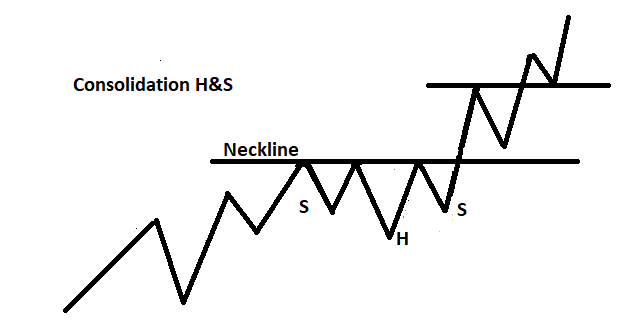
Similar continuation head and shoulders patterns can be seen in a downtrend market.
The main objective of analysing price patterns is to identify the battleground between buyers and sellers. If you identify the head and shoulders pattern, then you can forecast trend reversals.
Remember, perfection does not exist in technical analysis. It always comes down to probabilities, not certainties. Therefore, technical analysts always suggest deciding your stop loss before taking a trade.
In general, stop loss is below the second low in case the pattern is formed in a downtrend and above the 2nd high in case the pattern is formed in an uptrend.
No pattern is perfect, nor does it work every time.
Technical analysts always advise to apply common sense to price patterns rather than to apply strict text book rules.
Like every other price pattern in technical analysis, the head and shoulders pattern does not guarantee that the price will decline further if it’s created in an uptrend or will go up if it’s created in a downtrend.
Even though it’s not perfect, it provides a method of trading the market based on price movements.
List of Candlestick Patterns for your further studies;
- Evening Star
- Morning Star
- Bearish Abandoned baby candlestick pattern
- Bullish Abandoned baby candlestick pattern
- Three Inside up/down
- Three outside up/down
- Inside Bar
- Bullish Piercing
- Dark Cloud Cover
- Spinning Top
- Shooting Star and Inverted Hammer
- Hammer & Hanging Man
- Gravestone, Dragonfly and long-legged Doji
- Engulfing Candlestick Pattern
- Marubozu candlestick pattern
Disclaimer: In addition to the disclaimer below, please note, this article is not intended to provide investing or trading advice. Trading in the stock market and in other securities entails varying degrees of risk, and can result in loss of capital. Most investors and traders lose money. Readers seeking to engage in trading and/or investing should seek out extensive education on the topic and help of professionals.