In technical analysis we have different indicators to measure the movement of price for trading. One of such indicators used along with price action is Volume Weighted Average Price (VWAP).
Price action of a stock or any other financial security can be analysed by using candlestick charts and price patterns.
VWAP can be used along with other indicators for intraday trading. It looks similar to moving averages but it’s different the way it’s calculated and used.
In this article, you will learn what is volume weighted average price (popularly referred to as VWAP). You will also know how to plot VWAP in the price chart, Its use and limitations.
What is volume weighted average price (VWAP)?
The Volume Weighted Average Price is a technical Indicator that shows the average price of a security, adjusted for its volume on a price chart.
VWAP is calculated by totaling the traded value for every transaction and then dividing by the total shares traded.
Traded value is calculated by multiplying the price of the security with the volume traded. Total share means total volume of the underlying security for which you want to draw VWAP.
In simple words, VWAP is a trading indicator that shows the average price a security has traded at throughout the day, based on both volume and price.
Another most important thing to remember is that Volume weighted average price can only be used on intraday charts. It starts when the markets open and ends when the markets close for the day. It resets at the start of every new trading session.
When you plot it on a price chart, it appears as a single line on intraday charts. If plotted with a bunch of moving averages, then you can’t identify which one is Volume weighted average price unless and until you color it differently as it looks similar to a moving average line.
Here is the formula to measure VWAP:
Volume weighted average price = (Cumulative Typical Price x Volume) / Cumulative Volume
Where Typical Price = (High price + Low price + Closing Price) / 3
Cumulative = total since the trading session opened.
Here is how VWAP can be calculated for a 5 minutes chart;
First, you need to find out the average price of the stock traded on the stock exchange over the first 5-minute period of the day. Average price is calculated by adding high price, low price, and closing price, then dividing it by three.
Multiply average price by the volume for that period (5 minutes).
Now you have the numerator of the Volume weighted average price formula we have discussed above. Let us name the result as PV.
Now you have to divide PV by the volume for that period (5 minutes). This will produce the VWAP.
To keep calculating Volume weighted average price on a price chart or in a spreadsheet throughout the day, you continue to add the PV value from each 5 minutes period to the prior values. Divide this total by total volume up to that point. This means you have to divide cumulative PV by cumulative volume.
This is how VWAP is calculated.
However, a trader is not required to calculate the VWAP; it is done automatically on the trading software.
You need to select Volume weighted average price indicator from the technical indicators tab to plot it on your price chart.
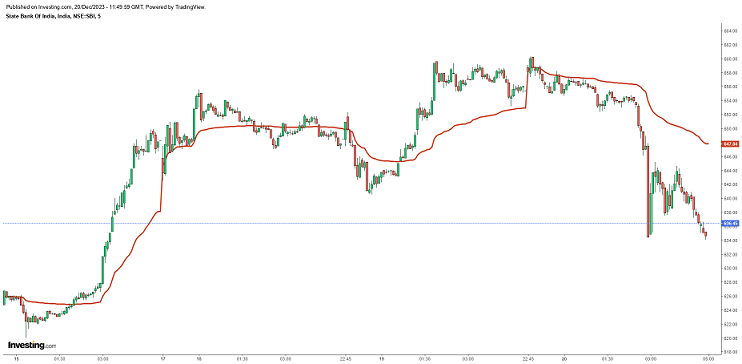
Following picture shows how Volume weighted average price can be plotted on a 5 minute chart. For example, we have taken the SBI chart, you can take any stock except indices.
Why use Volume weighted average price (VWAP)?
Volume weighted average price is important for intraday traders as it provides pricing insight into both the trend and value of a security.
By using VWAP, a trader will get the price action of a single day trading session plotted in one line.
Both retail and professional traders use Volume weighted average price (VWAP) to know the intraday price trend of the security. This means, VWAP is used as a trend confirmation tool and builds trading rules around it.
The trend is considered as bearish when the price is below the VWAP line and bullish when the security is trading above the VWAP line. Bearish trend is referred to as downtrend. Bullish trend is referred to as an uptrend.
If the market is not moving, then it’s called sideways consolidation or congestion based on how candlestick patterns are formed.
A trader may consider stocks with prices below Volume weighted average price as undervalued and those with prices above it, overvalued. If prices below VWAP move above it, traders may go long the stock. If prices above VWAP move below it, they may sell their positions or initiate short positions.
Institutional buyers including mutual funds use Volume weighted average price to help move into or out of stocks. In general, institutions will try to buy below the VWAP, or sell above it. This way their actions push the price back toward the average, instead of away from it.
You will not get VWAP plotted for an index such as Nifty 50 or Sensex, as it has no volume in it.
How VWAP is used in block deals
Let’s say someone wants to buy 10 Crore shares of a company listed in the stock exchange. They can’t buy them all at once because it will impact the market and cause the price to rise substantially.
Instead of placing 10 Crore shares buying order once. They will split the order into small pieces and execute them when price is at or near the VWAP without impacting the market. They may use Algo to execute orders automatically instead of doing it manually.
Big institutions use VWAP as a fair value for accumulation or distribution of a stock. Many professional day traders knowing this formulate their own strategy to trade in stocks around VWAP.
VWAP vs moving averages
As discussed above, Volume weighted average price (VWAP) is calculated by multiplying typical price by volume, and dividing it by total volume.
Volume works are a weight behind each buying and selling that takes place in the stock market.
A simple moving average incorporates price but not volume. The simple moving average (SMA) is calculated by totaling closing prices over a certain period (say 10 days) and then dividing the total by the number of periods (10).
Exponential moving averages are calculated similar to simple moving averages but it gives more weight to the recent prices of a security. Both simple and exponential moving averages do not take volume into account.
Another most important difference between moving averages and Volume weighted average price (VWAP) is what is known as flexibility. You can use moving averages on any price chart, it can be intraday, daily, weekly and monthly. Whereas Volume weighted average price can only be used on an intraday price chart.
In moving average, you will find a number of different strategies to use for trading such as golden cross and death cross.
Many day traders use both moving averages and Volume weighted average price (VWAP) while trading. In order to differentiate between moving averages and VWAP, they use different colors.
Limitations of Volume weighted average price (VWAP)
VWAP is an intraday indicator which restarts at the open of each new trading session. You cannot use or create an average VWAP in daily, weekly or monthly charts.
Some institutional traders may prefer to buy a security when the price is below the Volume weighted average price, or sell when it is above. However, VWAP is not the only factor that they consider for buying and selling of securities. Therefore, you can’t assume that the stock is a buy when it’s trading below the VWAP line and sell when it’s above.
In a strong bull market, prices of securities may continue to move higher for many trading sessions without dropping below the Volume weighted average price at all. Therefore, if you wait for the price to fall below the VWAP to buy, it could be a missed opportunity as prices will be rising quickly due to high demand.
Like any other technical indicators, Volume weighted average price is also based on historical values and can’t predict future price movement. Professional traders never use one indicator for trading. They always use more than one and interpret them within the context of the market.
Also Read: How fundamental analysis helps to find stocks for trading
Disclaimer: In addition to the disclaimer below, please note, this article is not intended to provide investing or trading advice. This article is for information purposes only. It is not a stock recommendation and should not be treated as such. Trading in the stock market and in other securities entails varying degrees of risk, and can result in loss of capital. Readers seeking to engage in trading and/or investing should seek out extensive education on the topic and help of professionals.